Skin hydration is a fundamental indicator of cutaneous health and the integrity of the stratum corneum (SC) barrier. Skin dryness is a significant clinical issue because it not only compromises the epidermal barrier, leading to increased transepidermal water loss (TEWL), but also accelerates dermal aging by promoting collagen degradation. Traditionally, researchers have relied on macroscopic biophysical measurements or the study of individual components like natural moisturizing factors (NMFs); however, these methods fail to capture the complex, microscopic biochemical networks driving hydration. To address this, an integrated multi-dimensional analysis—combining non-invasive imaging and untargeted lipidomics—was considered the ideal solution to provide a holistic, unbiased understanding of the systemic lipid metabolic dysregulation that characterizes dry skin.
Methods
The researchers enrolled 60 healthy Chinese women, categorizing them into low-hydration (LH) and high-hydration (HH) groups based on Corneometer measurements. The study employed confocal Raman spectroscopy (CRS) and multiphoton laser tomography (MPT) to assess SC thickness and biochemical composition, followed by untargeted lipidomics via UPLC-MS/MS to profile facial SC lipids. Finally, statistical correlation and lipid ontology enrichment analyses were performed to identify key biomarkers and metabolic pathways.
Key Findings
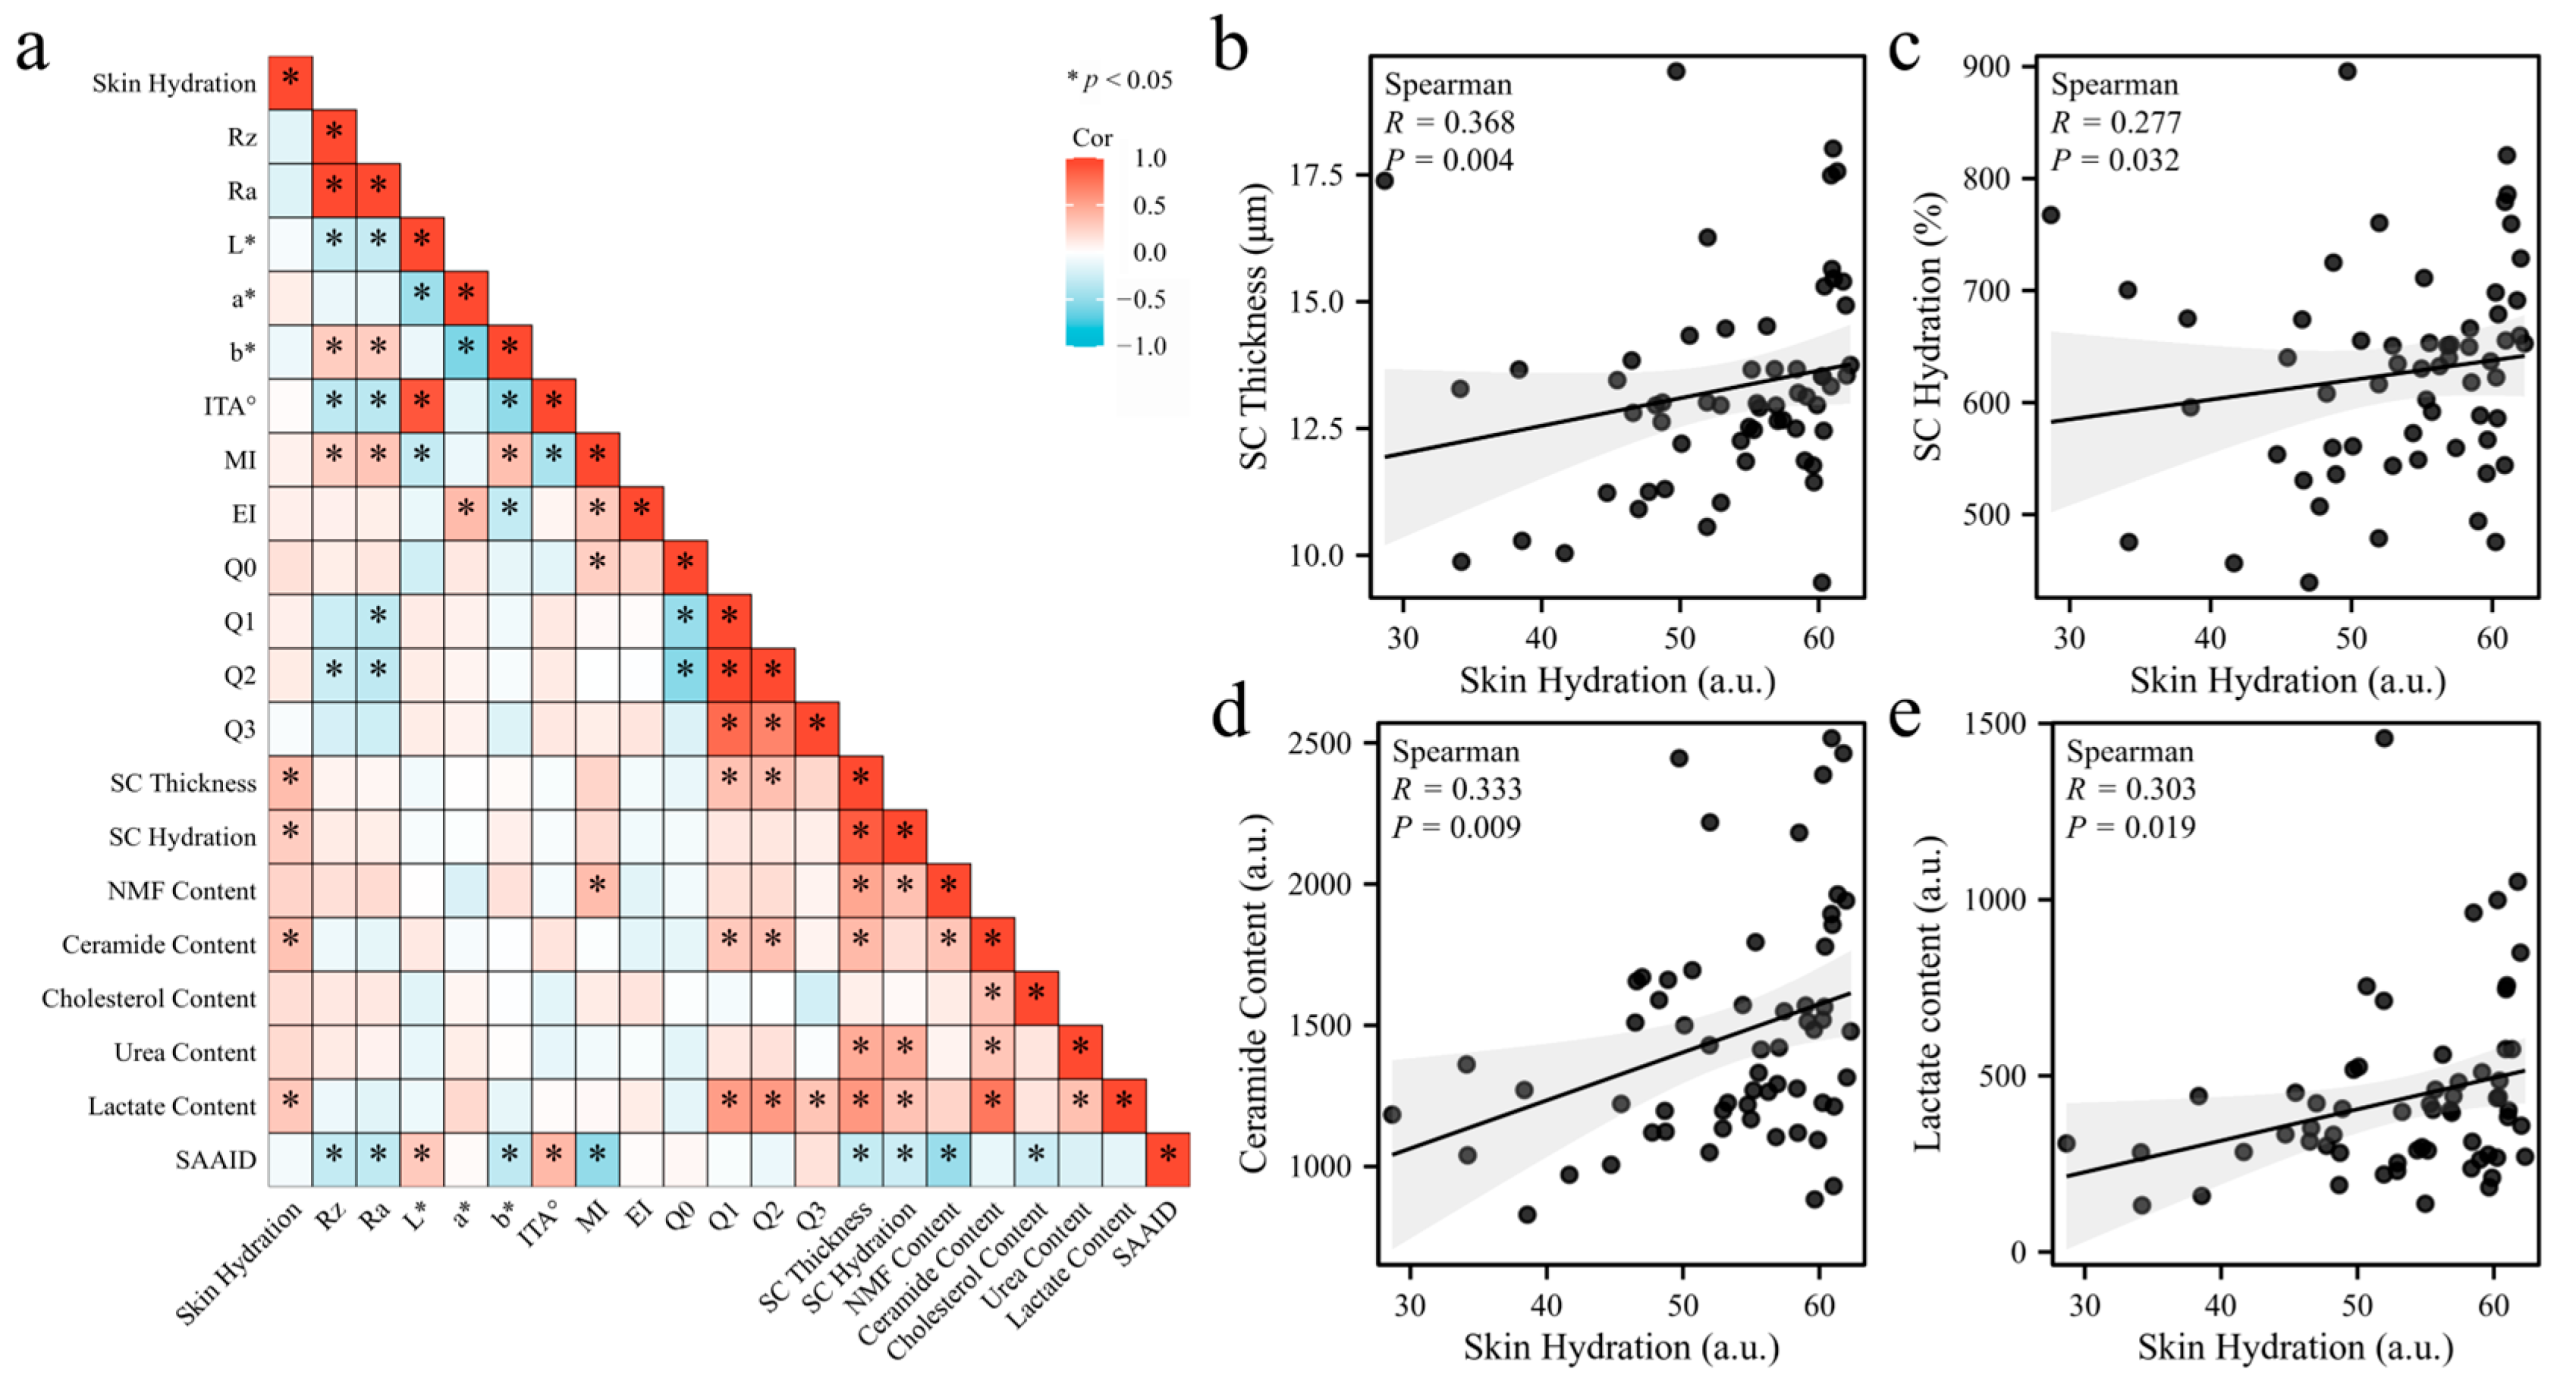
• Physiological Correlations: Skin hydration levels are positively correlated with SC thickness, ceramide content, and lactate levels, supporting their roles in structural integrity and moisture retention.
• Independent Parameters: No significant correlation was identified between facial skin hydration and wrinkles (roughness), skin color, or elasticity in the studied population.
• Systemic Lipid Dysregulation: Low-hydration skin is characterized by a broad upregulation of 83 differential lipids across 12 categories, including various ceramides, triacylglycerols (TAG), and free fatty acids.
• Ceramide Imbalance: Nine of the ten lipids most strongly associated with low hydration were ceramides (specifically Cer-AP, Cer-AS, and Cer-NS), suggesting that an imbalance in ceramide subtypes, rather than a simple deficiency, drives water loss.
• Metabolic Pathways: The lipidomic alterations in dry skin are primarily linked to the sphingolipid and triacylglycerol metabolic pathways, as well as changes in plasma membrane function.
This research is novel as it is the first to utilize untargeted lipidomics to compare global lipid profiles between high and low hydration levels, effectively redefining dry skin as a state of systemic lipid metabolic imbalance. Looking toward future implications, these findings shift the focus of dermatological interventions from the simple “supplementation of lipids” to the precise modulation of metabolic networks. By identifying specific molecular targets, this study provides a theoretical foundation for developing innovative, metabolism-based therapies and bioactive agents that can fundamentally restore skin barrier homeostasis and delay aging.
To understand this concept, imagine the skin barrier as a brick wall where the lipids are the mortar. Conventional wisdom suggests dry skin is simply “missing mortar,” but this research reveals the issue is more like using the wrong ratio of sand, water, and cement; even if there is plenty of mortar, the wall fails because the internal chemistry is unbalanced.
Link to the study: https://www.mdpi.com/2079-9284/13/1/4

Correlations between various facial skin parameters and skin hydration. (a) Heatmap illustrating the correlation matrix of different skin parameters. Data with p < 0.05 are marked with an asterisk (*). On the heat map, red indicates a strong positive correlation, blue represents a strong negative correlation, and white indicates no correlation. (b–e) Scatter plots depicting the correlation between skin hydration and SC thickness (b), SC hydration (c), ceramide content (d), and lactate content (e). EI (erythema index), MI (melanin index), a* (represents red and green shades), b* (represents blue and yellow shades), ITA° (individual typology angle), L* (indicates color brightness), Q0 (maximum recovery area), Q1 (gross elasticity), Q2 (net elasticity), Q3 (biological elasticity), Rz (average maximum roughness), and Ra (arithmetic mean roughness).